Histogram
A histogram is a graph that shows the frequency distribution of an image's data values, which makes it convenient for checking an image's brightness or darkness or the trends in the colors it uses.
With this camera, you can use the histogram to check the following.
For information on how to display the histogram, please refer to the 'Related information' section at the bottom of the page..
Note that you can switch between the [Brightness] and [RGB] displays using [ 
[Brightness] Display
This histogram is a graph showing the distribution of the image’s brightness level. The horizontal axis indicates the brightness level (darker on the left and brighter on the right), while the vertical axis indicates how many pixels exist for each brightness level. The more pixels there are toward the left, the darker the image. The more pixels there are toward the right, the brighter the image. If there are too many pixels on the left, the shadow detail will be lost. If there are too many pixels on the right, the highlight detail will be lost. The gradation in between will be reproduced. By checking the image and its brightness histogram, you can see the exposure level inclination and the overall gradation.
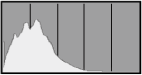 |  | 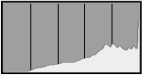 |
| Dark image | Normal brightness | Bright image |
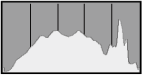
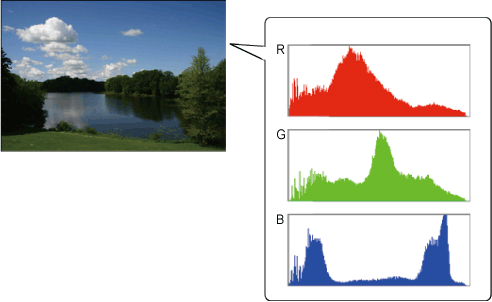
[RGB] Display
This histogram is a graph showing the distribution of each primary color’s brightness level in the image (RGB or red, green, and blue). The horizontal axis indicates the color’s brightness level (darker on the left and brighter on the right), while the vertical axis indicates how many pixels exist for each color brightness level. The more pixels there are toward the left, the darker and less prominent the color. The more pixels there are toward the right, the brighter and denser the color. If there are too many pixels on the left, the respective color information will be lacking. If there are too many pixels on the right, the color will be too saturated with no gradation. By checking the image’s RGB histogram, you can see the color’s saturation and gradation condition, as well as white balance inclination.
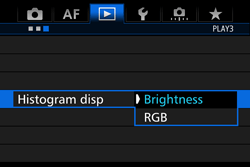
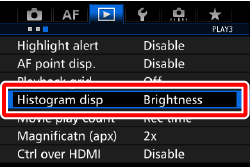
Changing the Histogram Display
To switch between the [Brightness] and [RGB] displays, follow the procedure below.
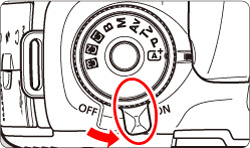
1. Set the camera’s power switch to ⋖ ON ⋗.
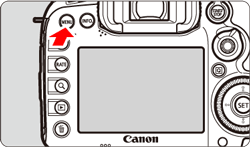
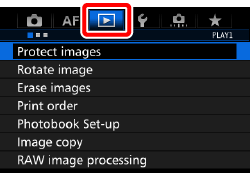
2. Press the ⋖ MENU ⋗ button to display the menu screen.
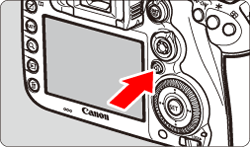
3. Press the ⋖

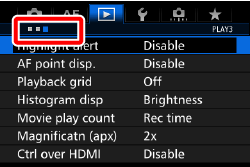
4. Turn the ⋖

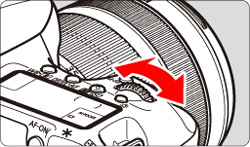
5. Turn the ⋖

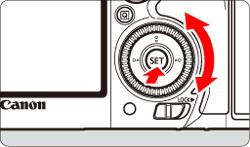
6. Turn the ⋖